
How to measure a small sales team’s performance
Track seven numbers every week and three more once a month, each with a one-sentence definition and a fixed cut-off time. Compare each seller with their own past weeks, show how many deals every rate rests on, and drop any number nobody acts on.
Start with seven weekly numbers
A team of two to ten people needs few numbers, read every week and left unchanged for months. Each one should change what somebody does on Monday. If a number moves and nobody would act differently, take it off the page.
The seven numbers below follow a deal from inquiry to sale. Read them for the team and for each seller. Four more are calculated from them each week: average deal size and the conversion from inquiry to conversation, conversation to proposal and proposal to sale. Win rate, pipeline coverage and the median sales cycle go on a monthly page with revenue, because one week holds too few decided deals for them.
- New inquiries: new requests and messages, each inquiry counted once. Split them by channel.
- Reply on time: inquiries answered within your standard, divided by all inquiries. The clock runs from arrival to the first reply by a person, in working hours.
- Conversations and meetings: held, not just scheduled. A chat that ended at the price list does not count.
- Proposals: sent in writing, with a price and terms. A price said aloud on a call is not a proposal.
- Deals with a step and a date: open deals with a next step and a due date recorded, divided by all open deals. A falling share is the first sign of a stuck pipeline.
- Sales: count and amount, by the rule you agreed, by payment or by signed contract. Do not mix them.
- Overdue: actions whose due date has passed.
Where each number lives in your CRM
Every number on the list comes from a date and a field you already have, or should have. Before the first count, find the field for each number and write it next to the definition. If two people would pull it from different places, you have two numbers with one name.
- Inquiries: the creation date of the lead or deal, and the source field. If sellers create deals days after the first message, ask them to create the deal at first contact.
- Reply on time: the time of the first outgoing call or message on the deal, minus the arrival time, checked against your standard. Many CRMs have no such column, so start with a weekly sample of 20 inquiries checked by hand.
- Conversations, meetings and proposals: the date a deal entered that stage. Count by stage entry date, because the stage a deal sits in today says nothing about this week.
- Sales: the payment date or the contract date, by the rule you agreed, and the amount. Never filter by creation date, or a slow month borrows results from a fast one.
- Deals with a step and a date, and overdue: an open task with a due date on each deal. A deal whose only task is overdue has no next step, and that task counts as overdue.
Count them the same way every week
An argument about a number is usually an argument about its definition. Write one sentence per number saying exactly what it counts, read the page to the team once and keep it where everyone can see it.
Fix the cut-off. Pick one moment, such as Friday at 6 p.m., and have the same person pull the numbers after it every week. A deal closed on Saturday belongs to next week. If sellers update the CRM on Monday morning for last week, the numbers change after you have read them, and nobody trusts the page.
Keep one sheet with a column per week. When a late update arrives, leave the old column alone and note the change in the current week. When you change a definition, mark the week on the sheet and stop comparing across that line.
The Seven weekly numbers kit has a spreadsheet laid out this way, plus a short numbers agreement the team can go through together.
Compare sellers fairly
A rate built on a handful of deals is mostly luck. Show the count of decided deals next to every rate. As a starting rule, test this one: below ten decided deals, mark a seller’s rate as early and do not compare it yet.
Compare like with like. Referrals and cold inquiries from advertising win at different rates, so split by channel before you compare people. Deal size works the same way: a seller on small orders and a seller on projects will have different cycles, and both numbers are right.
Credit the work to whoever did it. When a deal changes hands, the CRM shows the current owner, and the seller who qualified the lead and passed it on drops out of the count. Use the owner history, or count by who held the deal at each stage.
The fairest comparison is a seller against their own last eight weeks. Leave sellers in their first 90 days out of any ranking and judge them on their onboarding plan. A gap between two people is a topic for a one-to-one, and the weekly meeting is the wrong place for it.
What not to measure
Each number you add costs someone time to count and everyone time to discuss. Leave these out, at least for the first quarter.
- Calls dialed, emails sent, hours online. They reward motion. Count conversations held and next steps set instead.
- Total pipeline value with no filter. Deals nobody has touched for weeks inflate it. Close dead deals with a loss reason first, then read the pipeline.
- A weekly revenue leaderboard. One large deal decides it, and sellers learn to hold deals back for a better week.
- Scores for attitude or effort. Nobody can count them the same way twice.
- Any number nobody has acted on for a month. Remove it and see whether anyone asks.
Five minutes on the numbers, then a decision
Pull the numbers before the weekly meeting and give them its first five minutes. Read the movement against the last four weeks, and leave the absolute level for the monthly page.
Pick one number that moved for a reason you do not know yet, and ask the person closest to it. That conversation gives you the decision for the week: who does what, by when. Numbers read without a decision turn into a report, and the team stops listening.
Once a month, add revenue and the three monthly numbers: win rate, pipeline coverage and the median sales cycle. Show the owner the same page the team sees, so the company has one set of numbers.
An example with invented numbers
Example (invented numbers): a team of three sells IT support contracts, and the owner asks who the best seller is. Over eight weeks, Anna won 9 of 20 decided deals, which is 45%. Mark won 11 of 31, or 35%. Lena joined five weeks ago and won 2 of 4.
Split by channel, the picture changes. Anna’s deals were mostly referrals: she won 8 of 14 referrals and 1 of 6 inquiries from advertising. Mark worked mostly with advertising: 3 of 5 referrals and 8 of 26 ad inquiries. On ad inquiries Mark wins 31% and Anna 17%, though six deals are too few to call it.
The head of sales does not rank them. Lena’s 2 of 4 is marked early. The decision for the week: share referrals evenly from Monday and compare each channel again in eight weeks. Anna and Mark each see their own lines in their one-to-ones, with the count of decided deals next to every rate.
Do this week
By Friday, the head of sales writes one sentence of definition for each of the seven weekly numbers, names the CRM field next to it and sets the cut-off time for the first count.
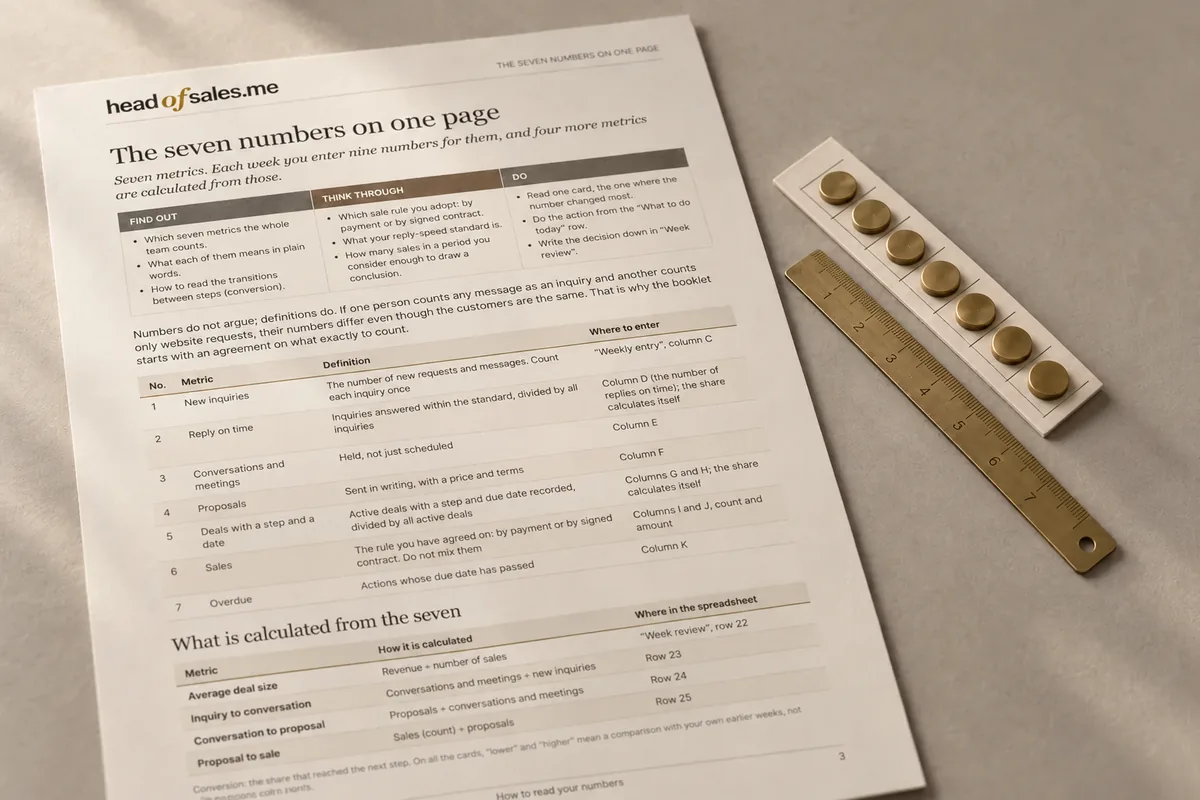
Which numbers to check every week, with one definition for the whole team.