
Sales dashboard
One screen with the few sales numbers the team acts on each week, each with a written definition.

In plain words
A sales dashboard is one screen with the numbers the team uses to decide what to do next. It is not a report of everything the CRM can count. Each number on it should change a decision. If it changes nothing, it should leave the screen.
It usually lives in the CRM or in a spreadsheet fed from it. A working dashboard holds a few outcome metrics, one or two activity metrics and pipeline coverage for the period. Each number has a written definition: what it counts, by which date, and what it leaves out.
Worked example (invented numbers)
Revenue $42,000 won against a monthly plan of $60,000, and $90,000 in open deals due this month: pipeline coverage of 1.5.
How to use it
Open the dashboard at the start of the weekly pipeline review, before you look at single deals. The head of sales reads the team line first, then each seller. The owner reads a monthly view with even fewer numbers: revenue, margin, the forecast and pipeline coverage.
The dashboard decides where the meeting goes. If pipeline coverage is low, the talk turns to new inquiries and channels. If coverage is fine but win rate falls, it turns to qualification and proposals. If outcome metrics drop, activity metrics show whether the cause is too little work or the wrong work.
The dashboard is only as good as CRM hygiene. Deals without amounts, stages nobody has updated and missing close dates turn every number into noise. Fix the data before you add another chart. A short weekly check of empty fields keeps the screen honest.
Common mistakes
- Too many numbers. A screen with dozens of tiles means nobody knows which one matters. Start with five or six numbers and add one only when a real decision needs it.
- No definitions. Two people read the same tile and mean different things by it. Write one sentence under each number, and agree on it with the owner.
- Mixing dates. One tile counts by creation date, another by close date, and the totals never match. Pick one date rule per number and show it on the screen.
- Building it and never opening it. A dashboard that no meeting uses decays within weeks. Tie it to the weekly pipeline review and the monthly owner review.
NEXT STEP · TOOL
By Friday, the head of sales lists every number on the current dashboard. Next to each one, write the decision it supports. Numbers with no decision come off the screen. Add a one-sentence definition under each number that stays. Then open the dashboard as the first item of the next weekly pipeline review.
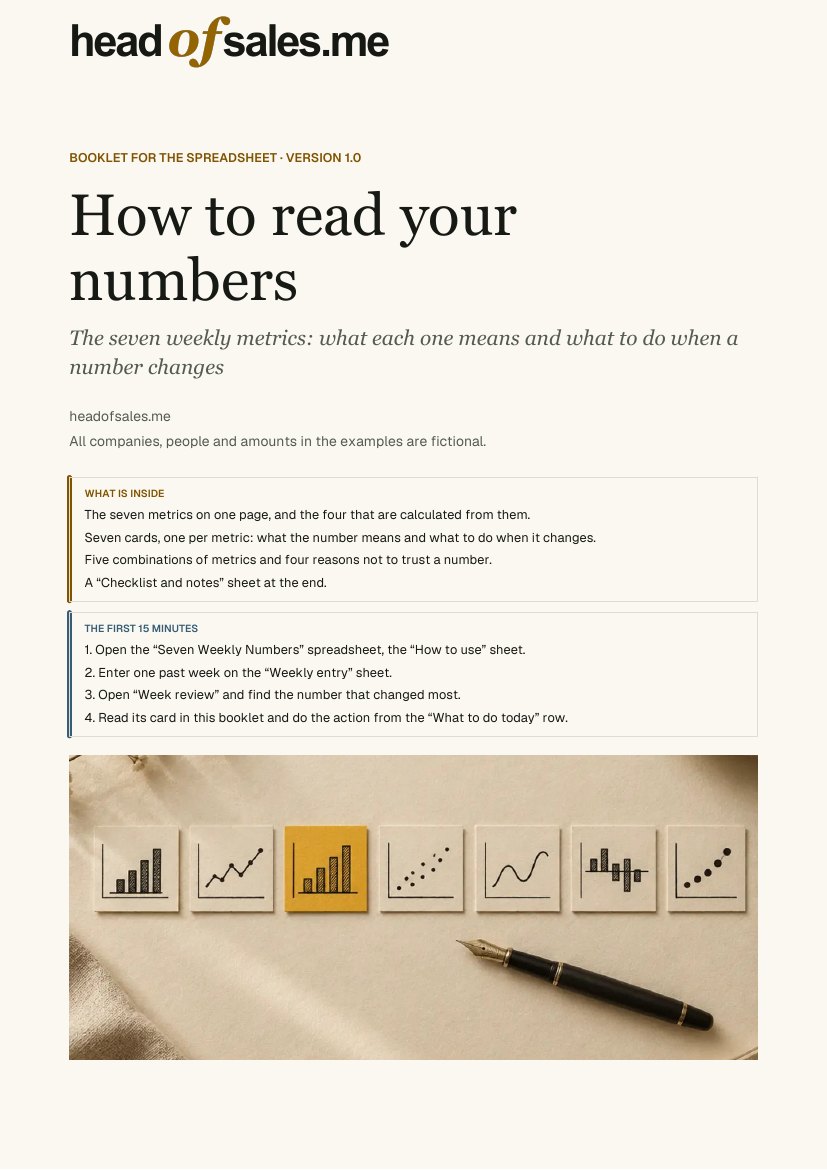
Which numbers to check every week, with one definition for the whole team.